Related articles
- Volcanic SO2 and SiF4 visualization using 2-D thermal emission spectroscopy – Part 2: Wind propagation and emission rates. A. Krueger, W. Stremme, R. Harig and M.Grutter. Krueger, Atmos. Meas. Tech., 6, 47-61, doi:10.5194/amt-6-47-2013, 2013. [link]
- Volcanic SO2 and SiF4 visualization using 2-D thermal emission spectroscopy - Part 1: slant-columns and their ratios. W. Stremme A. Krueger, R. Harig and M.Grutter. Atmospheric Measurement Techniques. 5, p. 275-288 (2012). doi:10.5194/amt-5-275-2012 (ISSN: 1867-1381) [link]
- Gas composition of Popocatépetl Volcano between 2007 and
2008: FTIR
Spectroscopic measurements of an explosive event and during quiescent
degassing. 2010. W. Stremme, I. Ortega, C. Siebe, M. Grutter. Earth and
Planetary Sciences Letters. Vol. 301, Issue 3-4, p. 502-510, (2011). [PDF]
- SO2 emissions from Popocatépetl volcano: emission rates and plume imaging using optical remote sensing techniques. M. Grutter, R. Basaldud, C. Rivera, R. Harig, W. Junkerman, E. Caetano and H. Delgado-Granados. Atmos. Chem. Phys . 8, 6655-6663 (2008). [PDF]
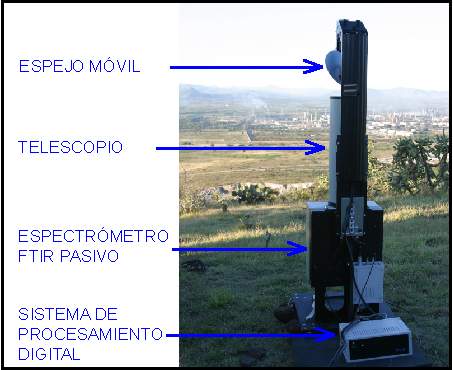
Scanning Infrared Gas Imaging System (SIGIS) developed by TUHH
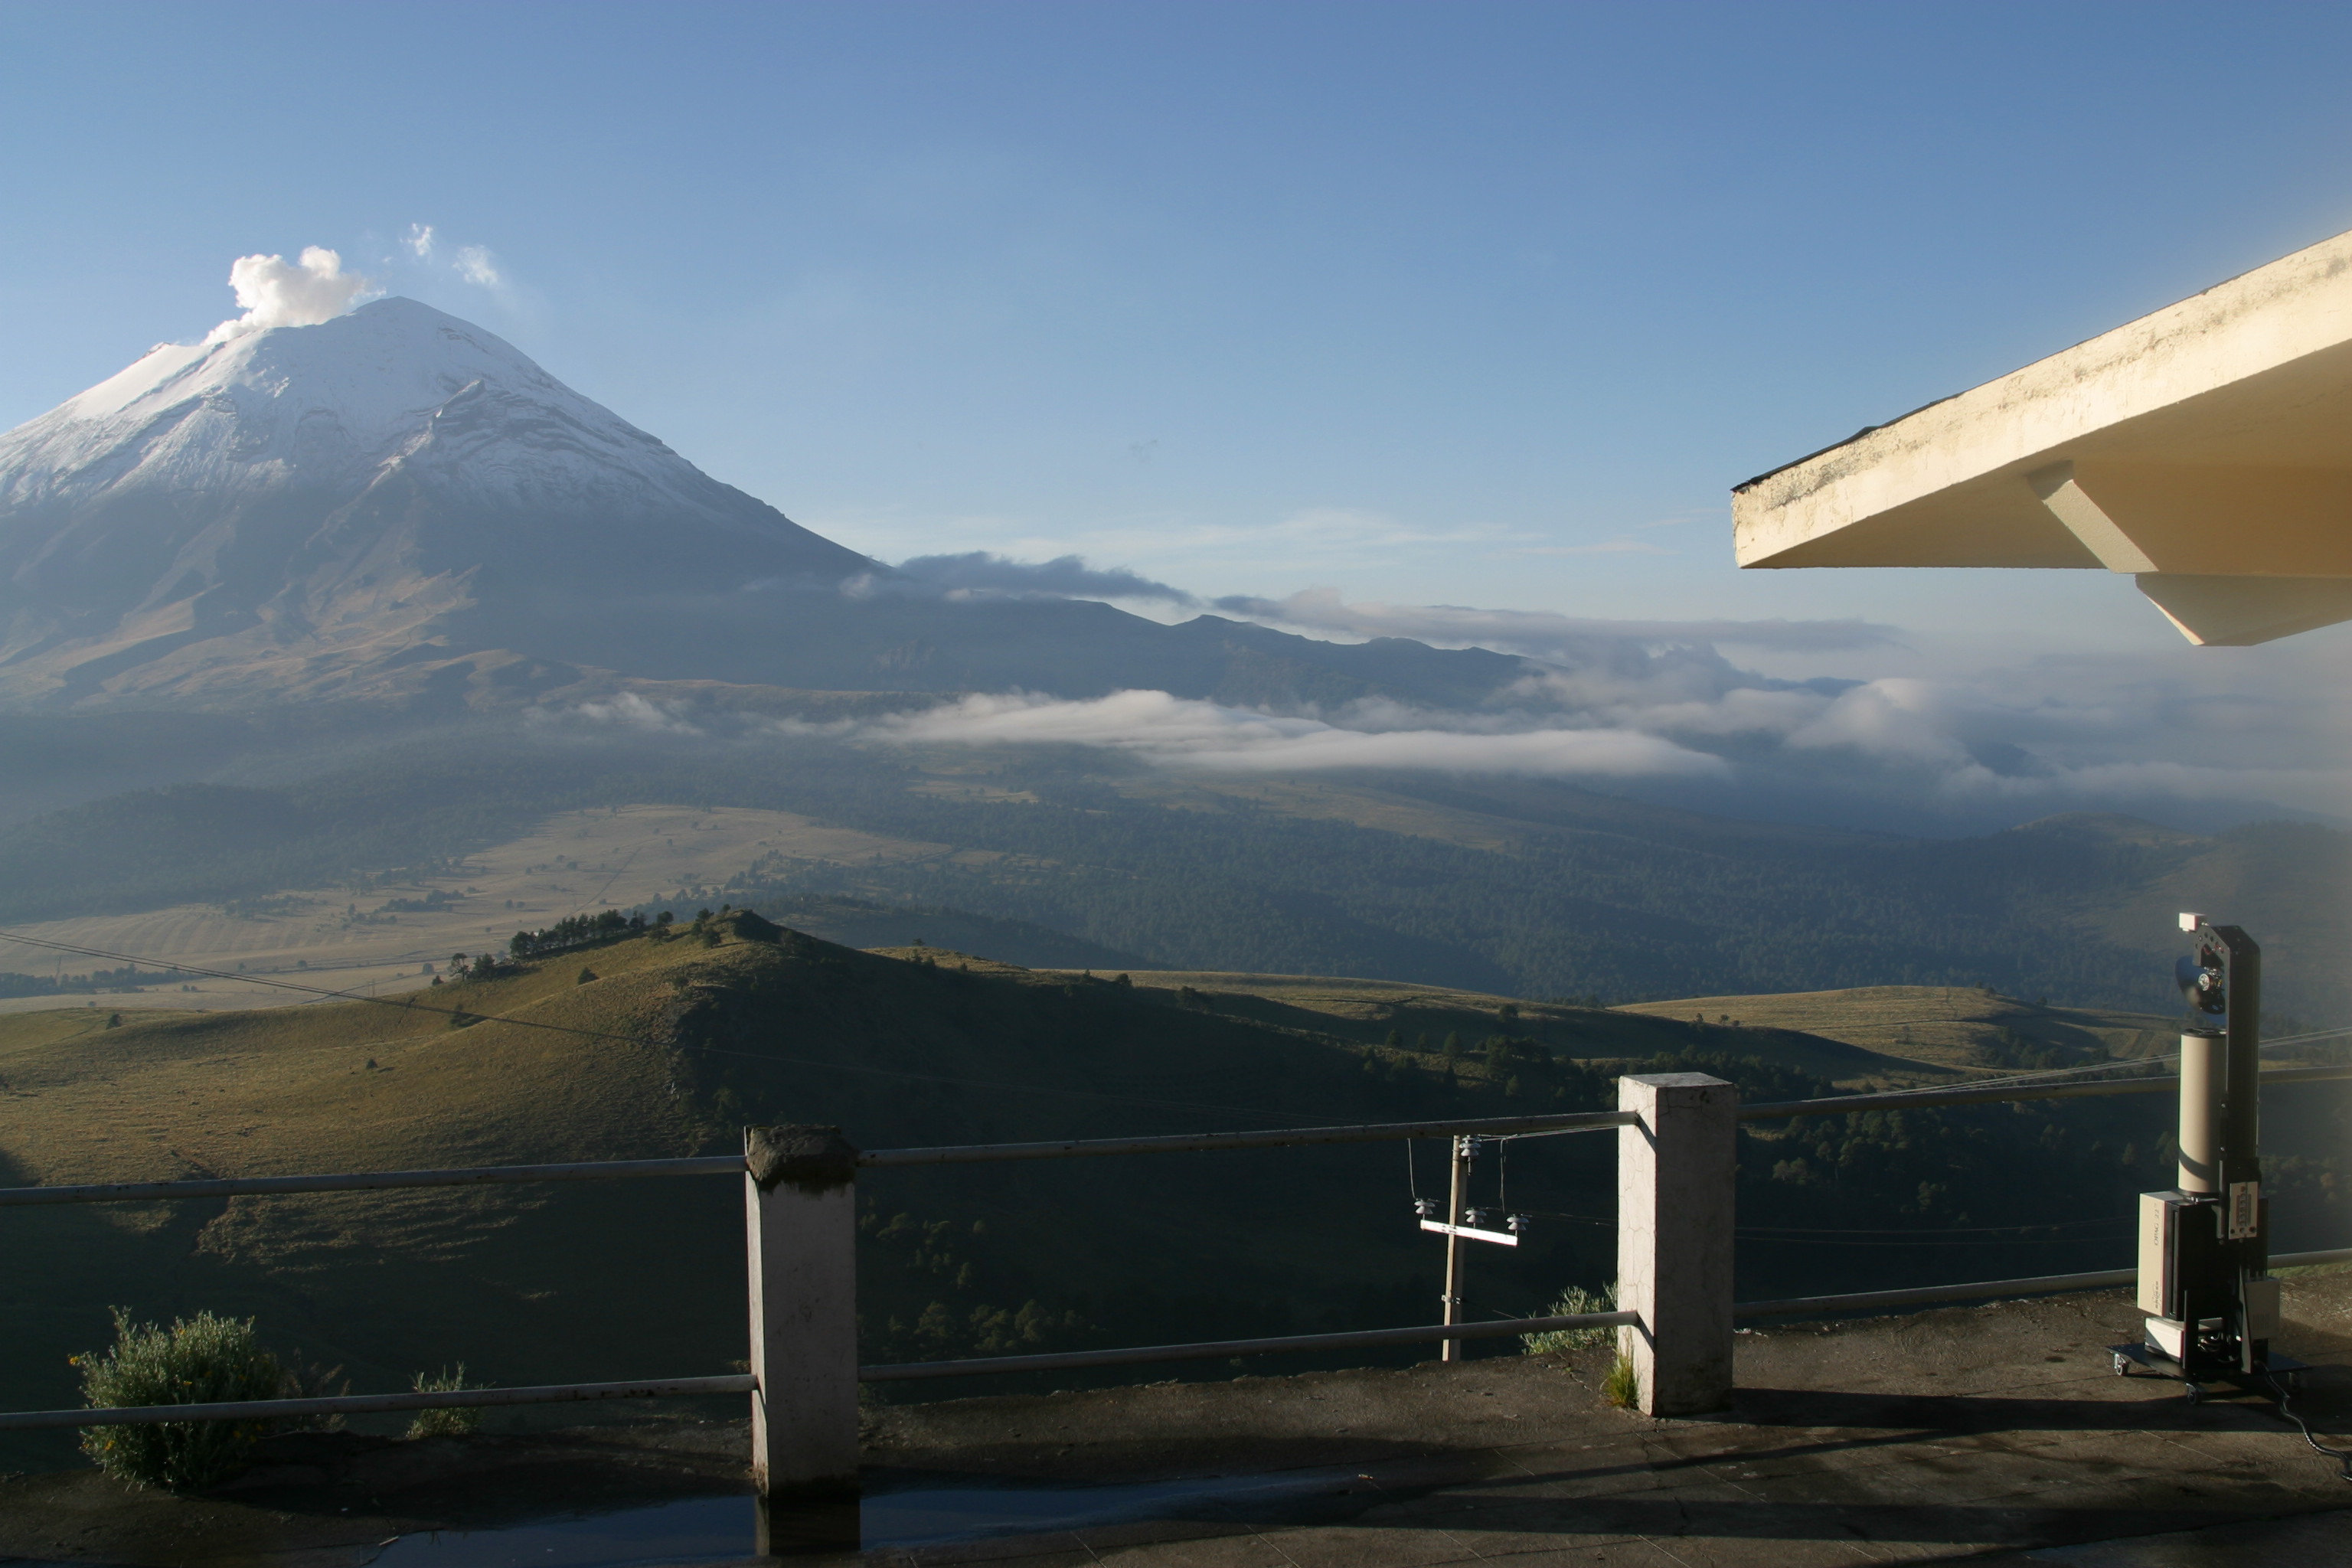
In this
picture one can see the SIGIS instrument looking at the
Popocatépetl volcano
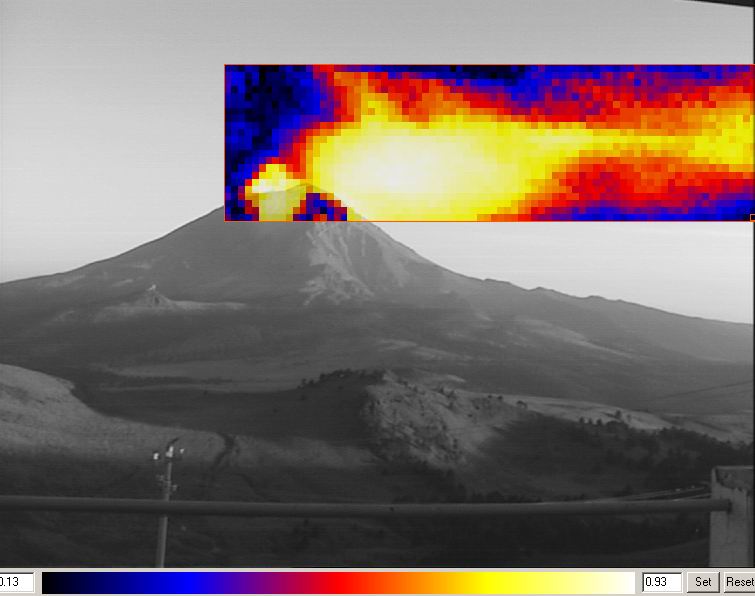
SO2 plume visualization from correlating a reference spectrum with the measured IR pectrum at every mirror position
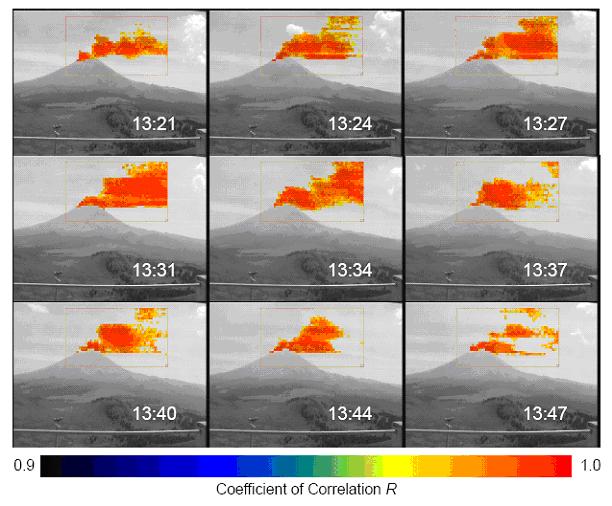
Evolution of the SO2 plume over time
SO2 plume visualization from correlating a reference spectrum with the measured IR pectrum at every mirror position
Evolution of the SO2 plume over time